Visualization
Polycrystalline diffraction patterns may be hard to decrypt without some visualization tools. This tutorial goes over some of the tools available in scikit-ued that help solve this problem.
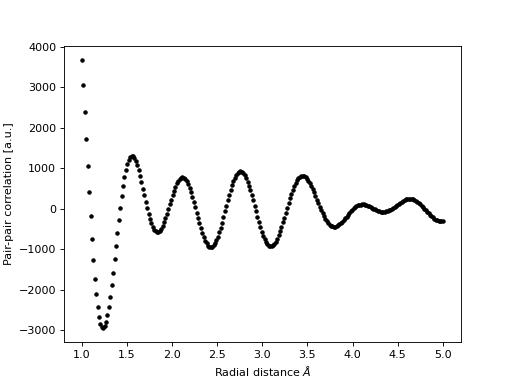
Patterson pair-pair distribution function
The calculation of the Patterson pair-pair distribution requires knowledge of the investigated material. You must also determine what range of real-space radii over which you want to calculate the distribution.
As an example, let’s use a simulated diffraction pattern of monoclinic VO$_2$:
>>> import numpy as np
>>> import matplotlib.pyplot as plt
>>> from crystals import Crystal
>>> from skued import patterson, powdersim
>>>
>>> # Simulation of polycrystalline diffraction pattern
>>> # for monoclinic VO2
>>> cryst = Crystal.from_database('vo2-m1')
>>> q = np.linspace(0.2, 10, 1024)
>>> I = powdersim(cryst, q)
>>>
>>> # Determination of the pair-pair distribution function
>>> rr = np.linspace(1, 5, 256)
>>> pairdist = patterson(q = q, I = I, crystal = cryst, radii = rr)
>>>
>>> fig, ax = plt.subplots(1,1)
>>> ax.plot(rr, pairdist, '.k')
(Source code, png, hires.png, pdf)